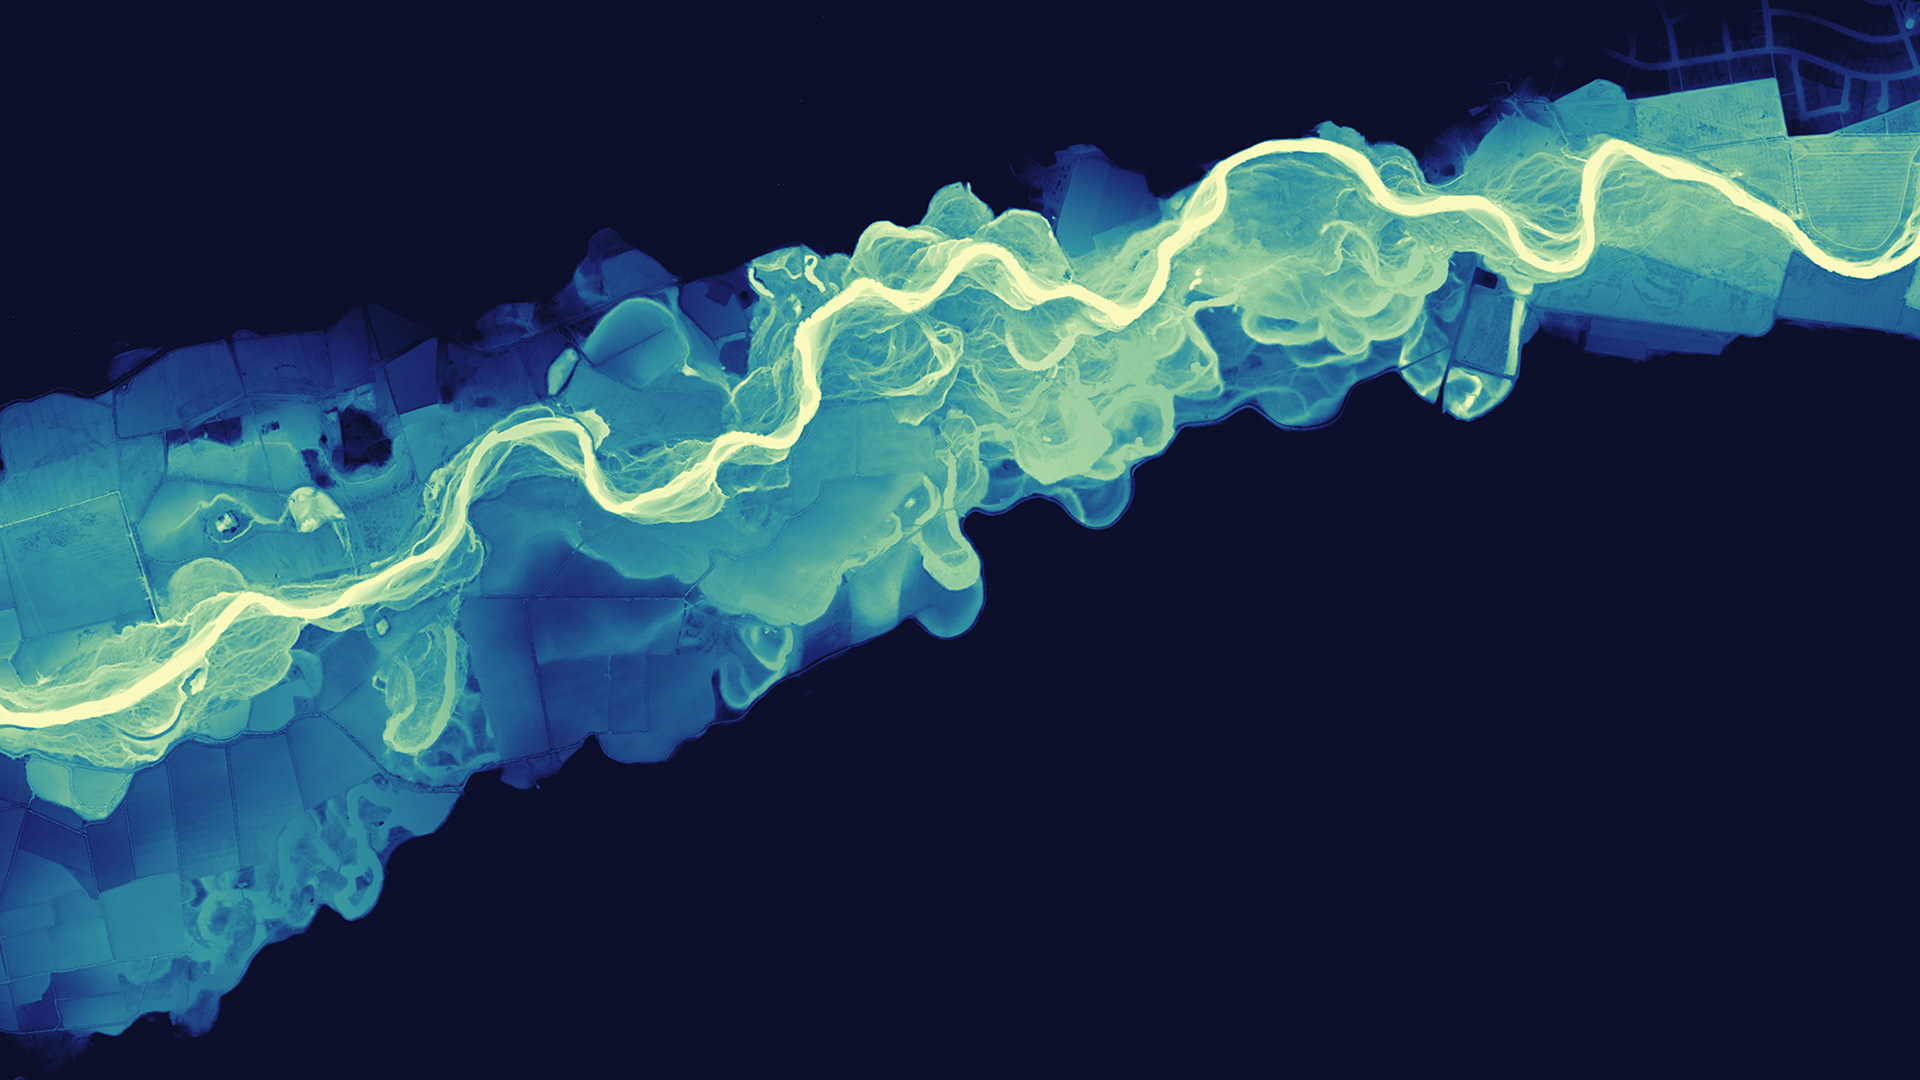
The Texel project was probably the most frustrating yet most satisfying map. Its idea was to take a 3D ground elevation map and run a TIN interpolation over a decreasing area. If you had limited the data correctly, it should look similar to the map in the third image. That map is from Dan Coe Carto. I followed the images outlined on his website for this project.
I decided to take my data for the Dutch island of Texel. Dan’s method is for rivers. He recommends only doing this on wild rivers as a managed river won't have the beautiful bends on the map. This is the first issue I ran into. Texels has one river and a floodplain but in the data, this isn't apparent. The second issue is that the river isn't natural. It was made when the dykes were built to reclaim some land in the northeast of the island.
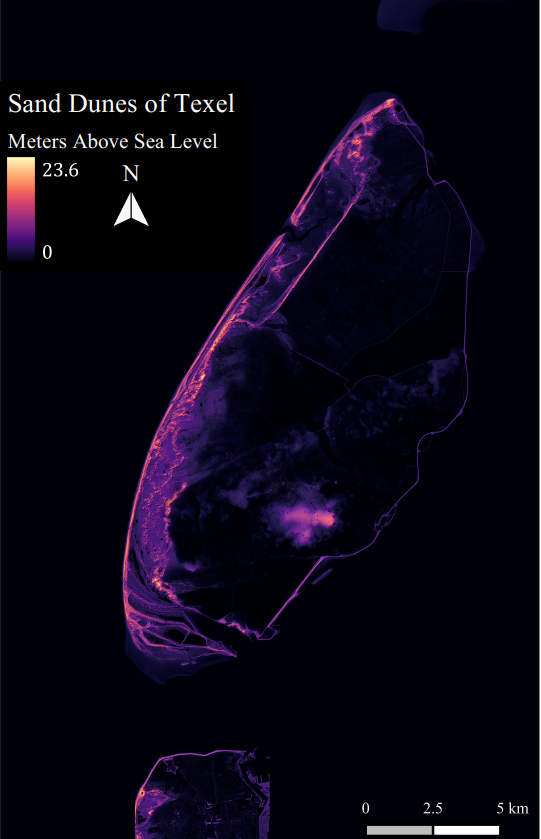
So after spending quite some time trying to get the river to work, I changed my goal to the dunes. The whole western half of the island is made up of sand dunes. I wanted to see if the shifting sand dunes would appear the same way the rivers do. And so, my day of trials began.
The problem really starts when the raster calculation is performed. The raster calculation takes every pixel and runs it through an equation that you create. I subtracted the TIN file from the image height. This should exaggerate the features of the carving rivers on the map. The only issue was that it ran for every pixel. In my data, 1 pixel was equivalent to ½ a meter. This means that for the 586 square kilometre island, the raster calculation would need to run an extremely large amount of calculations. The second image in the slide is the process after 4 hours. That was when left the computer running and went home. Come the morning, I checked on the data and it had been processed. It looked a little strange as not much had changed. In retrospect, I would have needed to flip the raster calculation from subtracting to adding to see any change, as the sand dunes are additive whereas a river removes land making it subtractive. The first image you see on the slide is not the REM image. This is because when I went to export the image, it crashed the computer and deleted the file. I later learnt that it was because the file was 18 gigabytes.
The map that you see is more of an exaggerated relief map of the sand dunes on Texel. But still, some very interesting features emerged. My favourite one is the old dykes. I was browsing old maps of Texel and saw the island was a lot smaller this was because the All Saint Flood destroyed much of the area and created the island of Texel and an island at the top of Texel today. So the Dutch, ever determined to steal land back from the sea, started building dykes on the island. And the fun part is that they are still visible today on my map. If you look at the mostly dark part of the island, there are faint purple lines that bisect the island. When looking at old maps, these lines perfectly follow the progress of land reclamation on Texel.
This was probably the map I'm most proud of, even though it didn't turn out how I wanted it, I find that the visual presentation is just stunning. It was also relieving to know that this was done in QGIS as I could try this again with a smaller dataset in hopes of making the sand dune REM work out in the end.