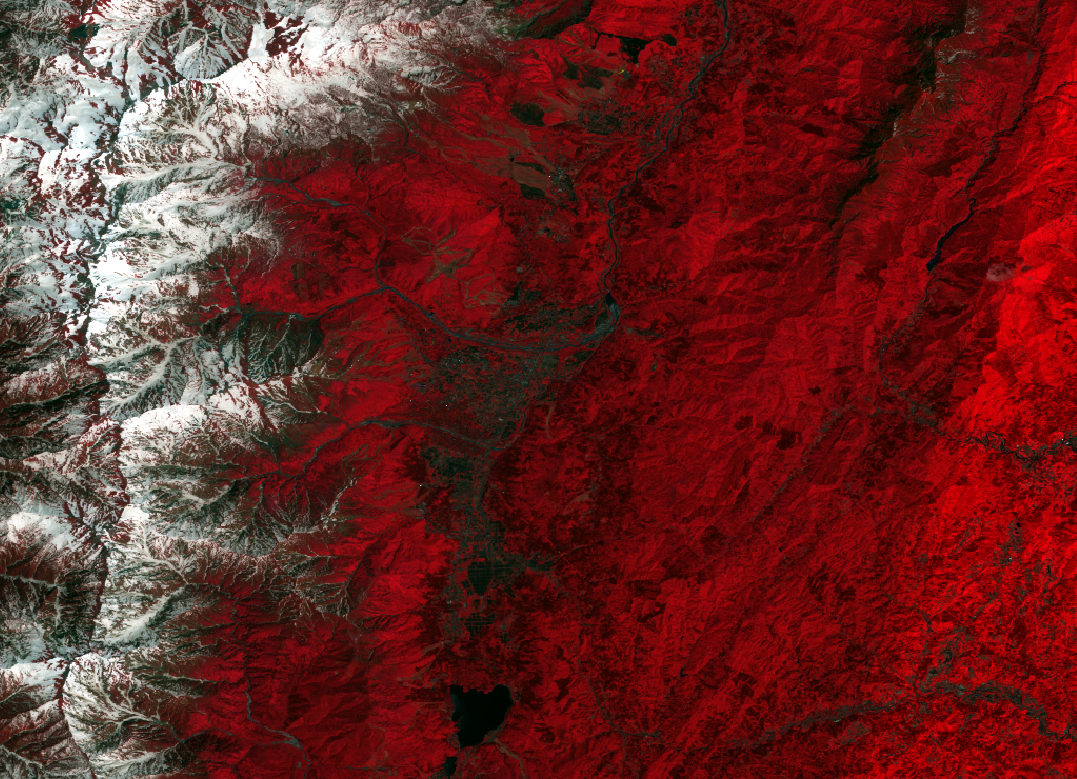
Infrared Image
1 / 6
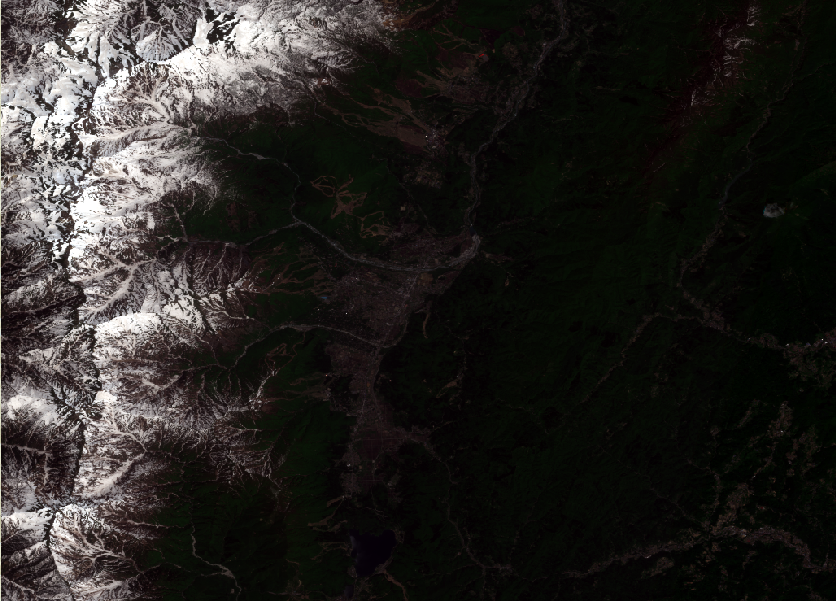
True Colour Image
2 / 6
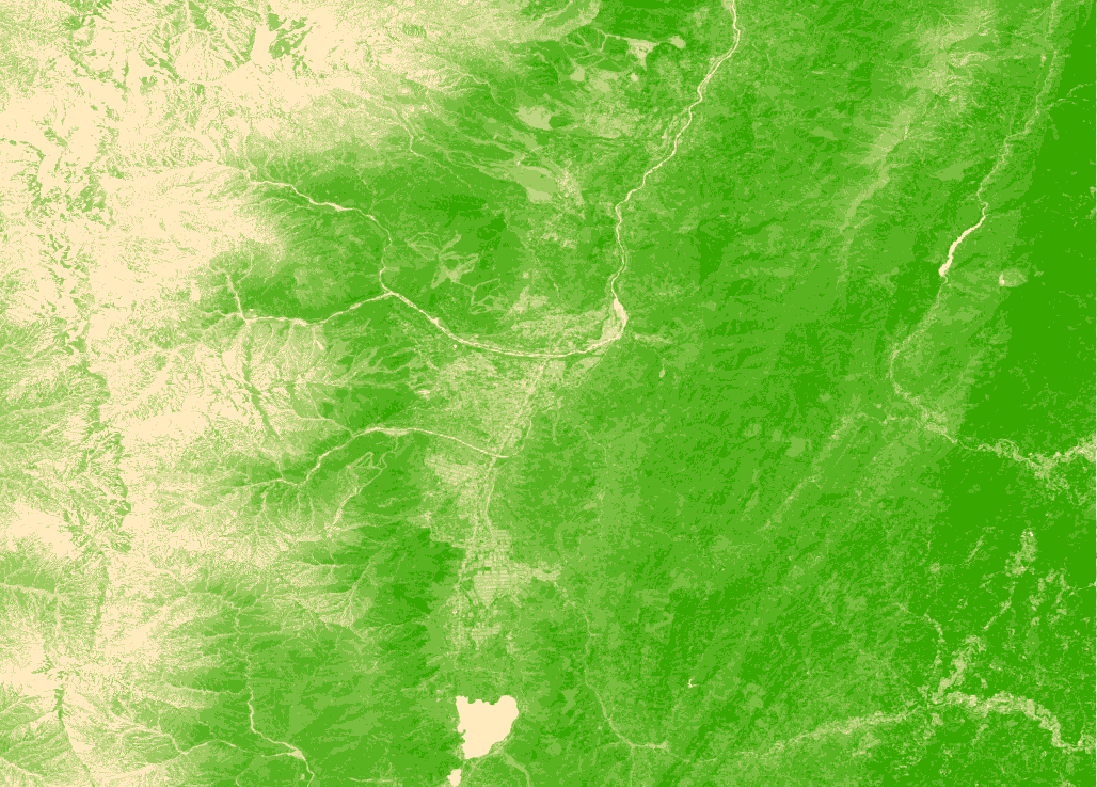
NDVI Image
3 / 6

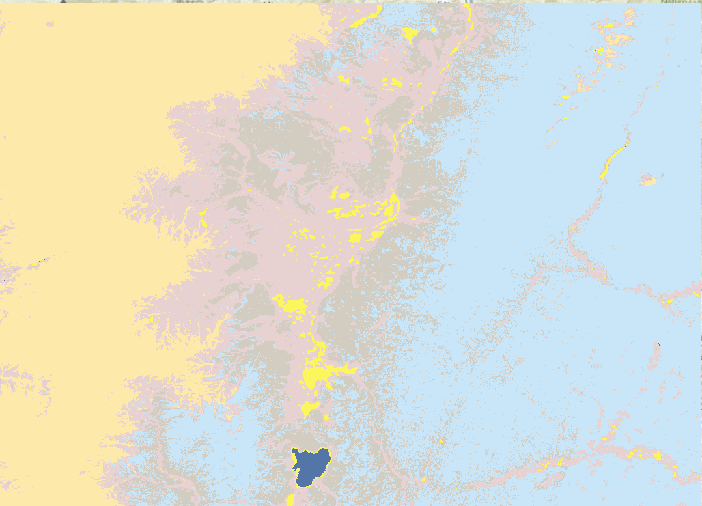
Object Based Classification
4 / 6
Pixel Based Classification
5 / 6
Supervised Pixel Classification
6 / 6